Solar guide · Annotated diagram
How to Read a Sun Path Diagram: Angles & Time
Learn how time, solar azimuth, altitude, horizon crossings, and seasonal curves fit together in a practical sun path diagram.
- Published
- Updated
Read each point by joining its local time, azimuth (compass direction) and altitude (height above the horizon). Start with the labelled example below, then use the same steps for your location and date.
The curve is an unobstructed astronomical baseline. It does not predict whether buildings, trees, terrain or clouds block the light at your observation point.
Annotated diagram
Brisbane near-equinox sun-path diagram dataset
This original diagram plots seven fixed Brisbane readings on 23 September 2026. Every labelled point has the same time, azimuth, and altitude in the table and downloadable CSV, so the visual can be checked without estimating from pixels.
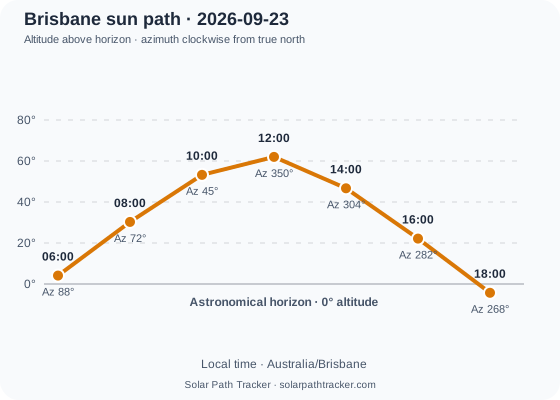 Open full-size diagram
| Local time | Azimuth | Altitude | State |
|---|---|---|---|
| 06:00 | 87.6° East | 4.1° | golden |
| 08:00 | 72.0° East | 30.3° | day |
| 10:00 | 45.4° North-east | 53.2° | day |
| 12:00 | 349.8° North | 62.0° | day |
| 14:00 | 303.7° North-west | 46.7° | day |
| 16:00 | 282.3° West | 22.1° | day |
| 18:00 | 267.8° West | -4.3° | night |
Download the evidence dataset
The plotted Brisbane near-equinox points shown in the original diagram and accessible data table. The UTF-8 CSV uses a fixed column order and contains calculated values only.
Start with the coordinate system
Solar Path Tracker reports azimuth clockwise from true north. North is 0°, east is 90°, south is 180°, and west is 270°. An azimuth of 72° therefore places the Sun east-north-east, not 72° above the horizon.
Altitude is a separate angle. Zero degrees is the astronomical horizon, positive values are above it, and negative values are below it. A 15° altitude indicates shallow light and usually long shadows; a 70° altitude indicates a high Sun and shorter shadows on level ground.
Follow one date from left to right
Read the local-time labels in sequence rather than comparing disconnected points. Before sunrise the altitude is negative. It crosses the horizon near sunrise, rises to a daily maximum around solar noon, then falls through sunset. Clock noon and solar noon are not guaranteed to coincide because longitude, timezone boundaries, and daylight-saving rules affect the displayed clock.
The azimuth curve should be read at the same timestamp as the altitude curve. This pairing tells you both which side of a site faces the Sun and how steeply the direct rays arrive.
Turn the chart into a site observation
Choose the date and hour that match the decision, note azimuth and altitude, then stand or orient a plan toward that bearing. Check whether the real horizon is clear. If an obstacle is present, estimate or measure its angular height and compare it with the solar altitude.
Repeat the observation for a winter and summer date. One day can answer a scheduling question; two seasonal references reveal whether a facade, courtyard, or outdoor workspace behaves differently across the year.
- Pair azimuth and altitude from the same timestamp.
- Use exact event tools for sunrise, sunset, and golden-hour boundaries.
- Verify true-north orientation and local obstructions before a consequential decision.
Responsible use
Practical uses and model limits
Useful for
- • Comparing morning and afternoon exposure before a property inspection.
- • Selecting useful observation times for a shading or facade survey.
- • Planning a photography angle around a known compass direction.
Do not overlook
- • A plotted point describes the Sun’s direction, not a promise of visible sunlight; terrain, buildings, trees, weather, and window geometry can block the direct beam.
- • Hourly samples are not substitutes for exact event timestamps between whole hours.
- • A magnetic compass can differ from true north; account for local magnetic declination when measuring on site.
Sources and reproducibility
Evidence and calculation sources
- NREL Solar Position Algorithm report
Independent reference for solar-position inputs and angular conventions; NREL does not endorse this site.
- SunCalc
Solar position and astronomical event calculations used by this site.
- Luxon
IANA timezone-aware conversion between the selected local time and UTC.
- Solar Path Tracker methodology
Definitions, angle normalization, polar handling, precision, and model limits.